Traksale
A sales workspace that connects revenue, orders, store traffic, and customer activity without making every metric compete for attention.
Project overview
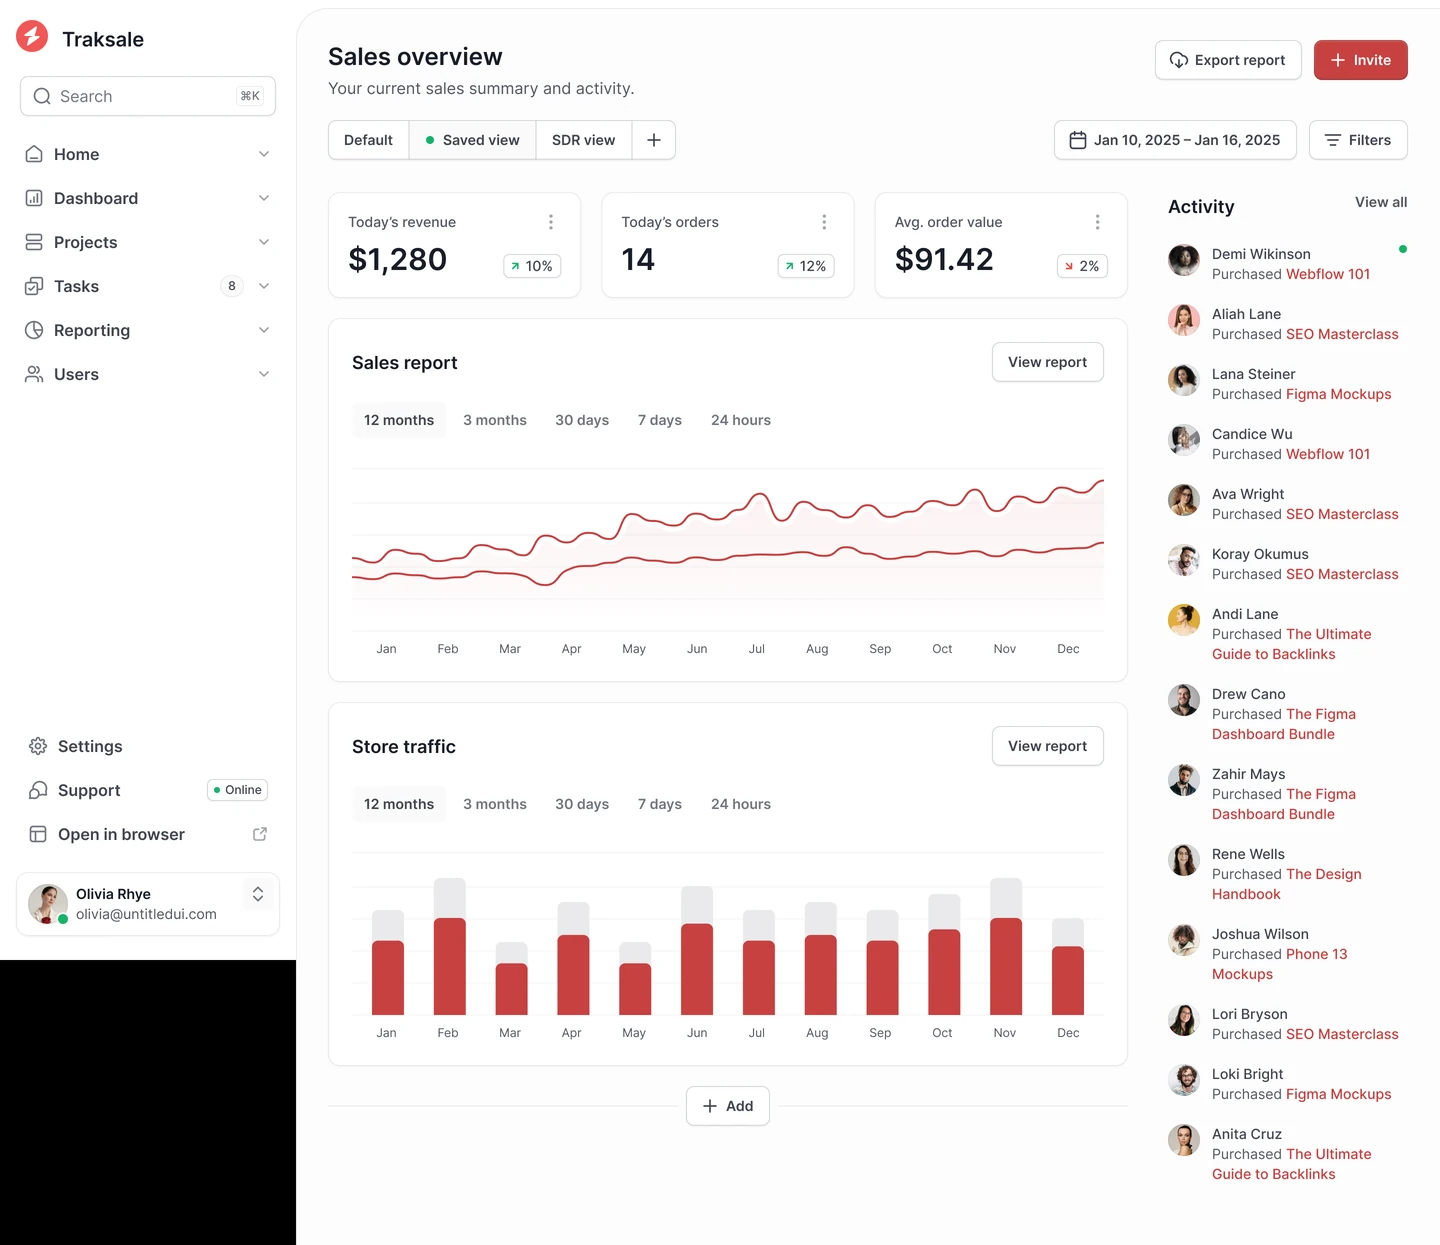
Traksale is a sales dashboard for e-commerce managers and digital product creators. It combines a daily performance summary with longer-term reporting and a customer activity feed, keeping the business overview and recent purchases in the same workspace.
The design challenge
Sales teams need both a fast answer to “how are we doing?” and enough context to explain a change. Revenue alone is incomplete without order volume, average order value, traffic, and recent customer activity.
Inside the experience
Daily performance at a glance
Revenue, orders, and average order value form the first layer of information. The compact summary creates a consistent place to start before opening a report.
Views that match different tasks
Default, saved, and SDR views sit alongside a date range and filters. The structure acknowledges that managers and sales representatives may need different slices of the same information.
A bridge between trends and activity
Sales and traffic charts show the broader pattern while the activity feed makes individual purchases visible. Export and invite actions support reporting and collaboration.
Design rationale
The visual hierarchy moves from summary to trends to individual activity. Repeated chart controls reduce the effort needed to compare time windows across reports.
What to validate next
Test whether first-time users can explain a revenue change and recover a useful saved view without assistance.