Bankrite
An AI-assisted banking dashboard that brings performance, customer retention, and risk signals into one clear workspace.
Project overview
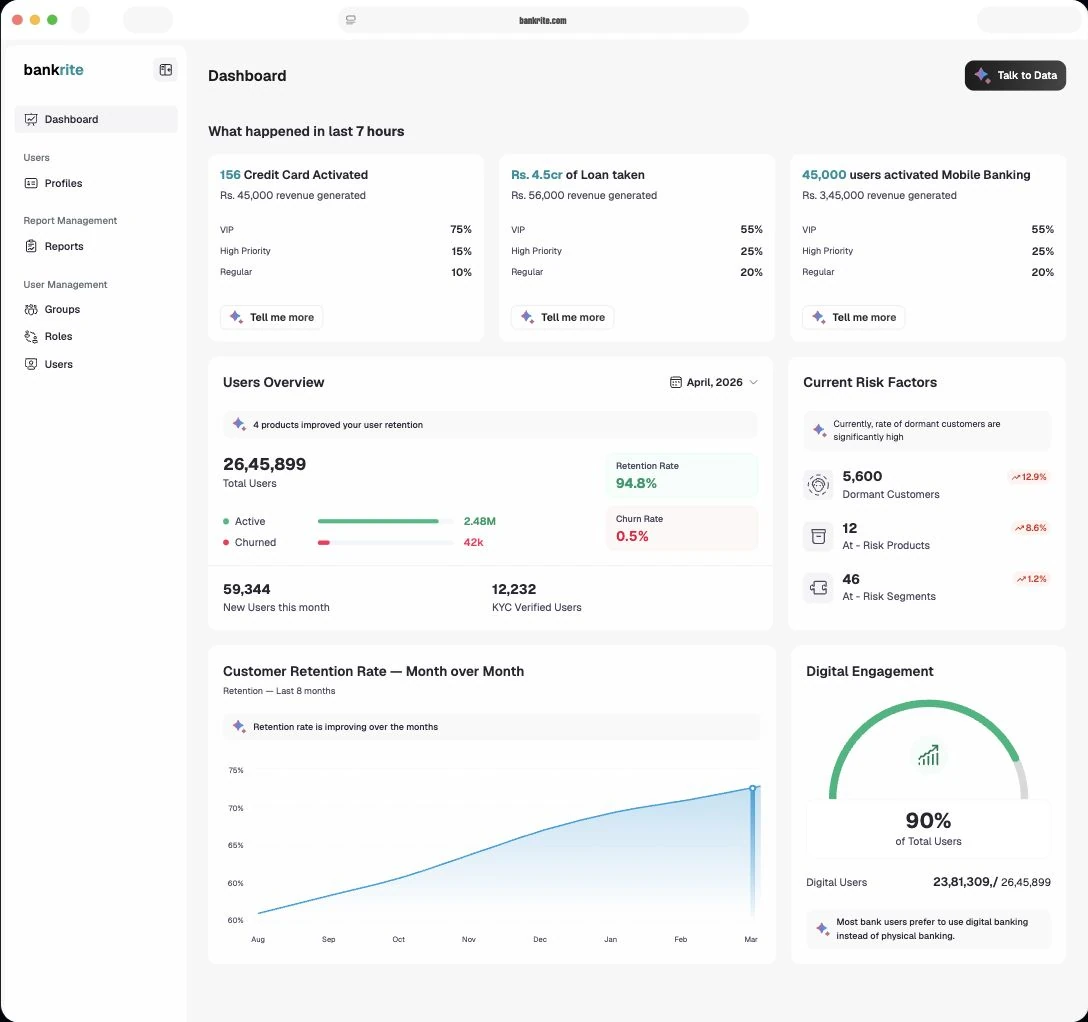
Bankrite turns high-volume banking data into an executive overview. The design brings together product activity, revenue context, customer health, and conversational data querying so decision-makers can move from a broad signal to a more focused question.
The design challenge
Banking teams need to understand activity across products and customer segments without losing the context behind a metric. A single total cannot explain who is disengaging, where adoption is changing, or which accounts need attention.
Inside the experience
A dashboard with a clear reading order
Recent product activity comes first, followed by the user overview, risk factors, retention trend, and digital engagement. This separates immediate changes from longer-term patterns.
Customer context beyond a single balance
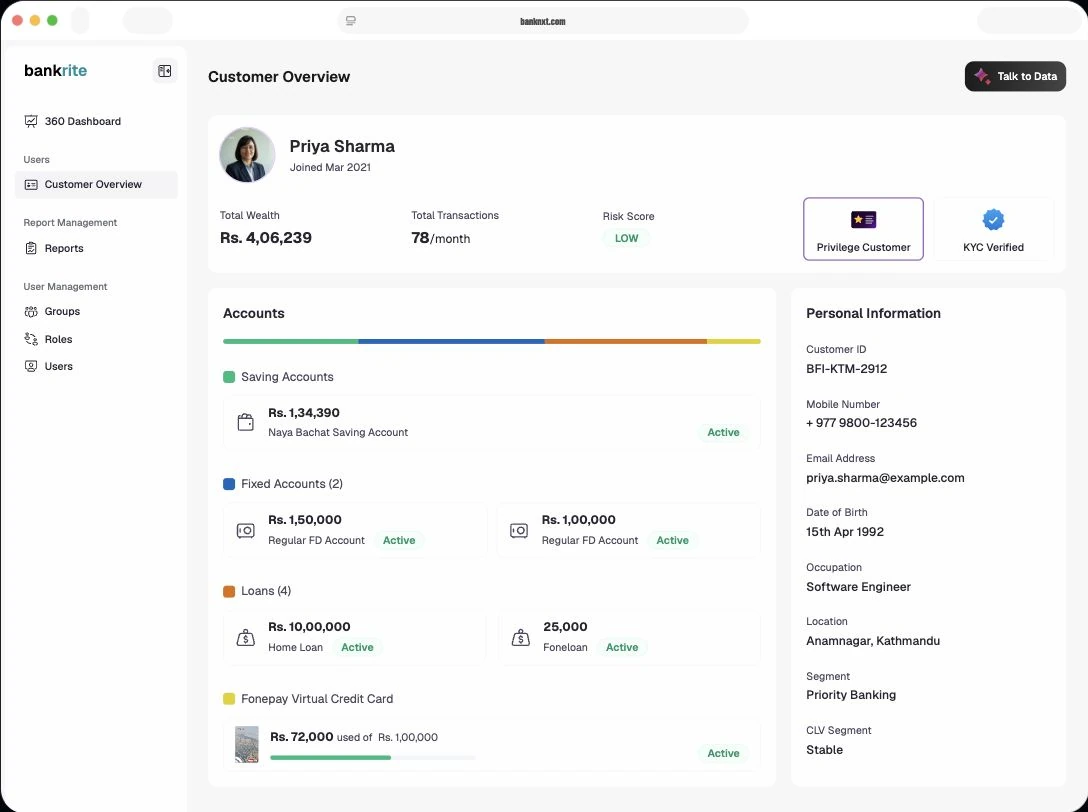
The customer overview groups accounts, fixed deposits, loans, and virtual credit alongside relationship and verification information. It connects the institution-level picture to a customer-level view.
Conversational access to data
The “Talk to Data” entry point makes AI-assisted querying visible alongside the dashboard. The interaction is presented as a way to explore questions beyond the default charts.
Design rationale
Summary cards support a quick scan; trends provide context; customer details support a deeper investigation. Keeping those levels distinct helps a dense financial interface remain readable.
What to validate next
Validate how executives interpret risk labels and AI responses, then test the route from a dashboard signal to a customer-level investigation.